A trillion dollars
Published 2026-06-15 on Farid Zakaria's Blog
This is not meant to be a political post.
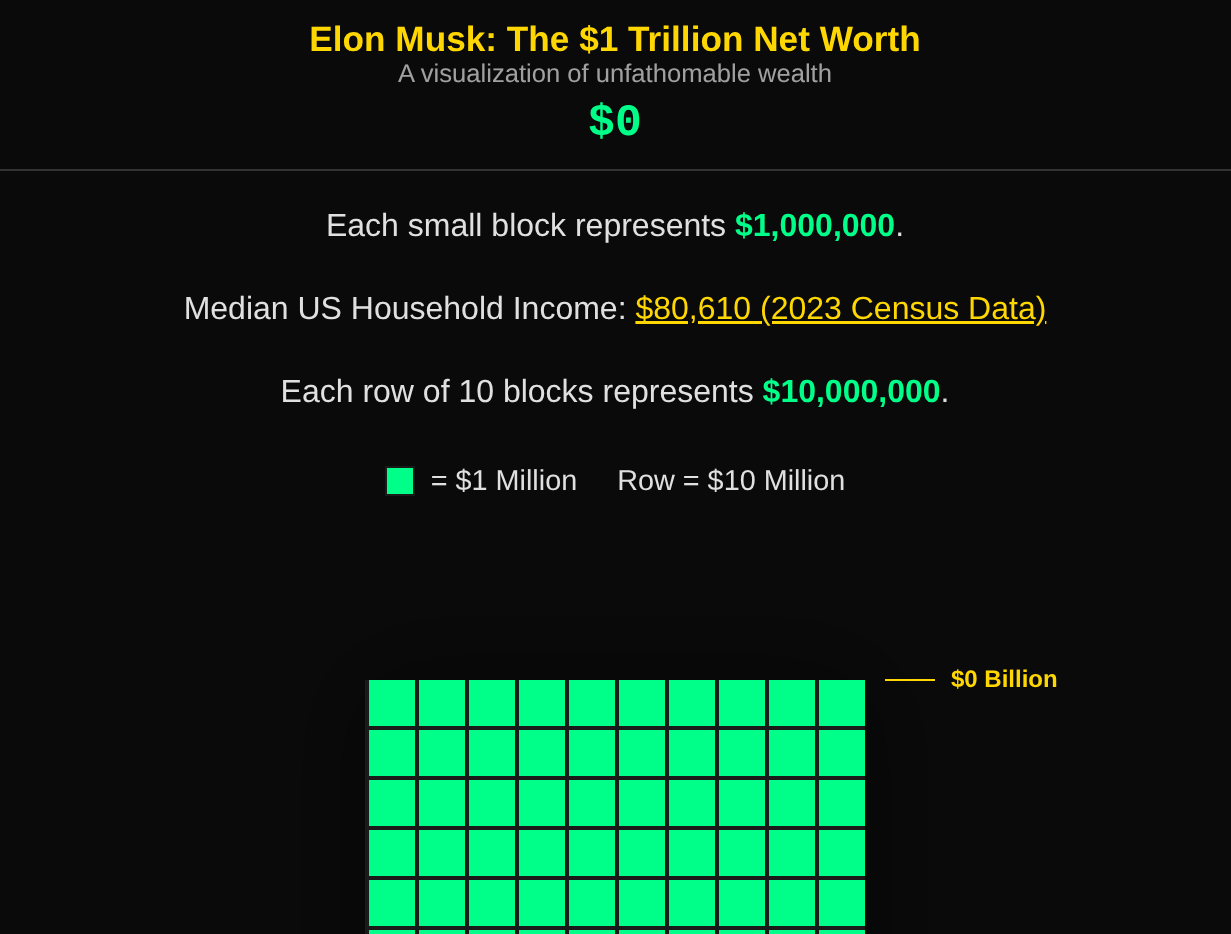
Headlines recently have been projecting Elon Musk’s net worth to hit $1 trillion USD.
Working in software, you inevitably come up against Jeff Dean’s latency numbers every programmer should know.
The original post wasn’t just insightful for sharing the time costs of common I/O operations. By using the scale of one access pattern to contextualize the next order of magnitude, it really helped entrench the cost of these increasing access patterns in my mind.
Scale at increasing orders of magnitude is often difficult to comprehend. Although logarithmic graphs are useful for showing exponential growth or displaying vastly different scales on a single chart, they are easily misunderstood.
If we were to map 1 million USD to 1 ns, what are the matching parallels to I/O access patterns?
| Latency Operation | Time | USD Equivalent |
|---|---|---|
| L1 cache reference | 1 ns | $1,000,000 |
| Branch mispredict | 3 ns | $3,000,000 |
| L2 cache reference | 4 ns | $4,000,000 |
| Mutex lock/unlock | 17 ns | $17,000,000 |
| Main memory reference | 100 ns | $100,000,000 |
| Read 1,000 ns sequentially from memory | 3,000 ns (3 µs) | $3,000,000,000 (3 Billion) |
| SSD random read | 16,000 ns (16 µs) | $16,000,000,000 (16 Billion) |
| Read 1 MB sequentially from memory | 250,000 ns (250 µs) | $250,000,000,000 (250 Billion) |
| Round trip within same datacenter | 500,000 ns (500 µs) | $500,000,000,000 (500 Billion) |
| Read 1 MB sequentially from SSD | 1,000,000 ns (1 ms) | $1,000,000,000,000 (One Trillion) |
I have seen similar graphics for representing wealth, but I decided to make my own – because why not.
Check it out: https://fzakaria.github.io/trillion-wut/ – how fast can you scroll to the bottom?
You can find the source available at https://github.com/fzakaria/trillion-wut.
Improve this page @ cf0dfdb
The content for this site is
CC-BY-SA.